
XR · Data visualization
Stock VR
Financial charts as a spatial workspace.
A VR application for exploring financial data through interactive charts inside a virtual trading floor.
- My role
- Sole developer
- Platform
- Virtual reality
- Project context
- OCTAV
01Building the VR application
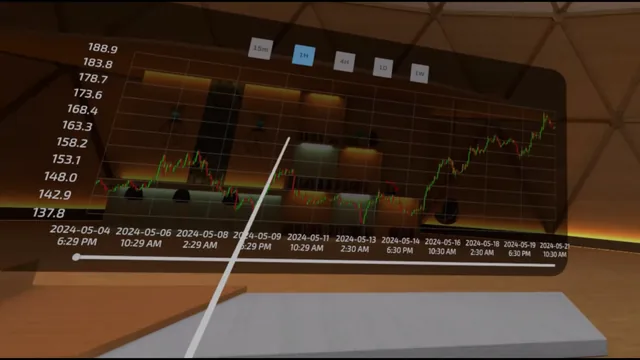
I was the sole developer of Stock VR. The project presents financial data as an interactive workspace in virtual reality.
My programming contribution sits within the wider OCTAV project, with the published visuals credited to the studio.
02Reading data in three dimensions
Users enter a virtual trading floor and explore three-dimensional line and candlestick charts. VR controllers provide a way to select chart types and interact with the data displays.
The project focuses on spatial presentation and interaction with financial information.
03See the project.
Official OCTAV project video. YouTube loads only when selected; playback does not start automatically. Watch on YouTube ↗
Project links & credits
Project imagery and demonstration video are credited to OCTAV. My role is described above.